How Maryland used GIS to build its COVID-19 response website
To ensure government officials and residents alike had access to accurate, real-time COVID-19 data when the virus began spreading earlier this year, Maryland state agencies quickly began using geographic-information-system data to map the spread of the virus, officials said during an online conference on Wednesday.
But Julia Fischer, Maryland’s geographic information officer, said the project represented a learning experience for many of the officials involved, who came from agencies including the Geographic Information Office within the Maryland Department of Information Technology, the state’s health agency and its emergency management agency.
The state’s coronavirus response website, coronavirus.maryland.gov, was built to “provide a narrative of the reality” of the pandemic through data, said Fischer, who presented a case study of the website at the National States Geographic Information Council’s annual conference. Coronavirus response websites like Maryland’s have been a priority for state agencies trying to centralize data about the pandemic rapidly this year.
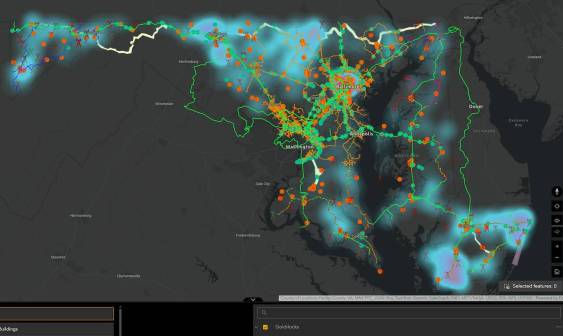
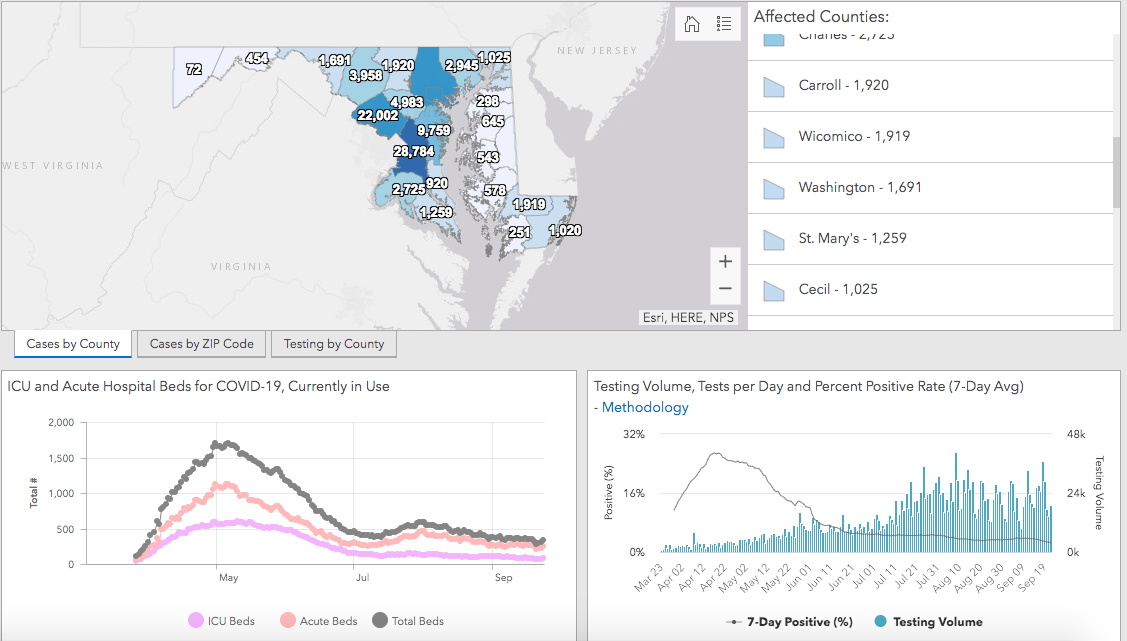
Since its launch, the website has served as a hub of collaboration between officials in the governor’s office, local community agencies and the state’s health care system, many of whom were unaware that GIS data could provide new insights into the state’s pandemic response strategy, Fischer said. It now offers visualizations of virtually all of the state’s COVID-19 data, broken down by county, race, gender and ethnicity. It also includes resources for state officials to contrast the location of testing sites with new clusters of cases.
And critically, Fischer said, it’s a place that Marylanders can go to receive timely COVID-19 data that they may not get anywhere else.
“Many of them have been exposed to GIS, but this is another opportunity to continue to impress upon them,” Fischer said.
When the virus spread across Maryland in March, she said, the state had limited resources to disperse information — including daily caseloads, hospitalizations, equipment inventory — to local officials and the state’s six million residents. Consolidating disparate case data from different hospitals and testing locations became Fischer’s first goal, alongside making the website accessible for disabled residents and mobile users, the latter of which account for 60% of its users. Empowering local agencies, like those in Baltimore County, to use the site’s APIs to filter coronavirus data for a single city or county became the next mission after the website was operational, she said.
“We’re communicating a singular message through multiple levels of government by sharing from a singular source,” Fischer said. “The more that we can share the data, the more that we can expand upon who is looking at the data, that’s going to provide so many positives for ourselves, the feedback we can receive to improve the data we’re putting out.”
Outside of ensuring that the data could be visualized, Fischer said, her team also had to ensure that it was reliable, meaning that every testing location in the state, even those in rural areas, had to be included in the site’s search feature. To do so, and to foster a relationship with civic-minded residents, the state adopted a submission form that allowed users to share the location of testing sites that hadn’t yet been identified by the website. More than 50 testing locations were shared in the first few days, Fischer said, and the site has seen more than 6.5 million users since launch.
Some of those users have taken it upon themselves to share the data even further, she said, downloading public data from the site and creating their own charts and graphs to share on social media.
“Collaborative analysis should be encouraged,” Fischer said. “That way you’re going to reveal correlations. You’re going to bring people into the conversation with new perspectives, fresh perspectives.”