Los Angeles controller publishes maps showing city’s inequities
A series of maps published Thursday by Los Angeles City Controller Ron Galperin scores how inequitable the distribution of wealth, education and clean air are across the city’s neighborhoods.
The maps make up the city’s first “Equity Index”, Galperin’s latest data-driven project, following a series of resource maps that laid out where Angelenos could find food and financial assistance during the coronavirus pandemic.
The index is composed of four categories — socioeconomic, environmental, access to resources and education — and breaks down Los Angeles by census tracts, so that each tract is given a score in each category on a scale from 0 to 10. For example, Census Tract 261101, in the wealthy Hollywood Hills, has an equity index of 8.3 out of 10, including 9 out of 10 on access to resources.
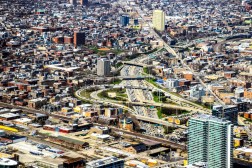
Tracts in the downtown area and eastern side of the city score far lower, with few tracts scoring above a 6. Though the data that the maps are based off of is largely publicly available from the U.S. Census Bureau, visualizing the contrast in quality of life was a worthwhile effort, Galperin said.
“I believe the results will be useful for policymakers and residents for many months to come,” Galperin told StateScoop via email. “It is one thing to have a general sense of inequities and barriers to opportunity and it is entirely another to be able to pinpoint exactly what those are on a very micro, almost block by block level.”
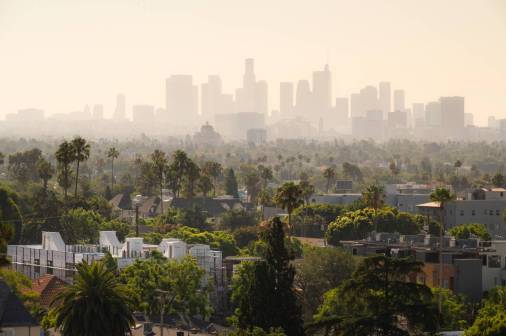
The project itself took five months to bring together, Galperin said, and involved data collection and analysis with help from the U.S. Department of Agriculture, the Census Bureau and the University of Southern California. Within the maps, created on an Esri platform, users can zoom in and see how each census tract scored on individual metrics. Air quality in the Palisades, located along Los Angeles’ northern coast, is better than in downtown, where air pollution exceeds what the Environmental Protection Agency deems to be safe.
The report also includes maps that detail where Angelenos with high school and undergraduate degrees are more likely to reside, and where broadband internet is most available, visualizing a digital divide that’s been exacerbated by the pandemic.
“The issue became even more important when the structural inequities in our society were spotlighted this summer by the mass movement for racial justice and equity,” Galperin said.
Galperin has produced several data-driven feature reports on more specific issues over the past several years, but the broad nature of Thursday’s report will lend itself to use by Los Angeles policymakers, he said, noting that City Council members and Mayor Eric Garcetti’s office have already reviewed the findings.
“It is a project created by the Controller’s Office, but it really meant to be a tool for all city leaders, residents, and stakeholders to use,” Galperin said. “If we want to make Los Angeles more equitable, it is going to take a lot of policy work, informed by data and analysis, along with support from community members armed with a general understanding of how and where we need to push harder to bridge the equity divide.”