LA’s new ‘resource hub’ shows which neighborhoods get stimulus checks
Los Angeles Controller Ron Galperin’s office launched a new website last week to centralize coronavirus data and corral hundreds of the city’s assistance programs for groups like seniors, immigrants and artists.
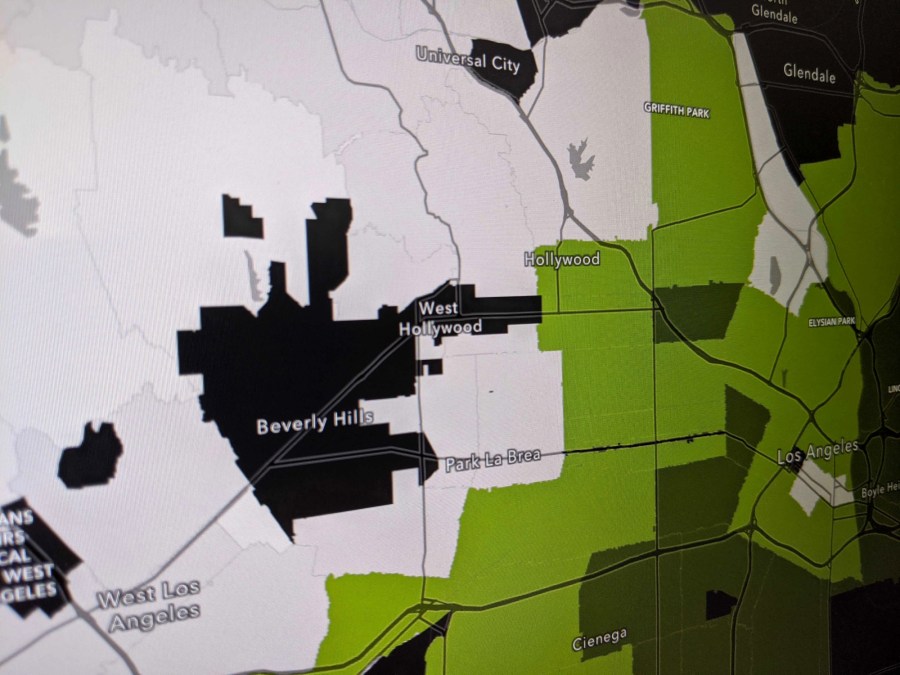
The COVID-19 Resource Hub is the latest data-centric effort from Galperin’s office meant to inform L.A. residents about how the virus is spreading and what financial and medical resources are available. The website contains a map that plots COVID-19 cases and deaths in the region and a map that shows which neighborhoods might receive full stimulus checks through the CARES Act.
Galperin told StateScoop the website is designed to impart a better understanding of where people are struggling during the pandemic, which has killed nearly 70,000 people in the U.S.
“It gives people a better sense of the communities in which they’re living,” Galperin said. “But it also gives the decision-makers in this city — the nonprofits and others — a better roadmap of where resources are going to need to be allocated.”
Galperin said the stimulus-check map highlights a stark economic divide in Los Angeles County, where 93.4 percent of residents from the Wilmington neighborhood who filed tax returns will likely receive full $1,200 checks, compared to just 60.9 percent of residents in Studio City, a neighborhood where higher household incomes often prevent inclusion in the stimulus program.
“Those areas that are lower-income, those areas that have more people that qualify, are also the areas that are going to need more help in the coming weeks, months and frankly years as we seek to recover from this pandemic not just medically, but economically,” Galperin said.
In addition to maps, the resource hub also asks users to choose from 16 categories — such as small-business owners, job seekers, nonprofits and homeowners — to find city, county and federal assistance programs, such as those offering educational resources, legal assistance, city services or internet access.
Galperin has made data visualization a hallmark of his work as city controller. In March he published an interactive map of grocery stores and food banks open during the pandemic.
“I believe that there’s tremendous power in how you visualize [data] and make it accessible to people,” Galperin said. “What we sought to do was bring together a whole variety of different resources that were in different places.”