California’s fire maps and drone photos lend new views of the devastation
California is in the middle of one of its worst wildfire seasons on record, with more than a dozen active blazes scorching the landscape, forcing evacuations and claiming lives. One, the Carr fire, located around the rural city of Redding, caused eight deaths and more than 37,000 evacuations, with people who fled their homes only starting to return last weekend.
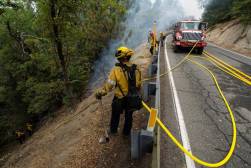
Meanwhile, the flames across California have tested the state’s firefighters, who now have to contend with a wildfire season that seems to last 12 months a year. And as the fires come under control, federal, state and local officials will have lots of recovery work on their hands.
One tool that governments are making extensive use of right now is geospatial imaging, allowing officials to more closely track how widely the fires are burning and assessing the damage when the flames are put out. Using software by mapping and data analytics firm Esri, governments in fire-affected areas have put together series of maps that allow the public to see how far the flames have spread, where structures have been damaged or destroyed and whether it’s safe to return or not.
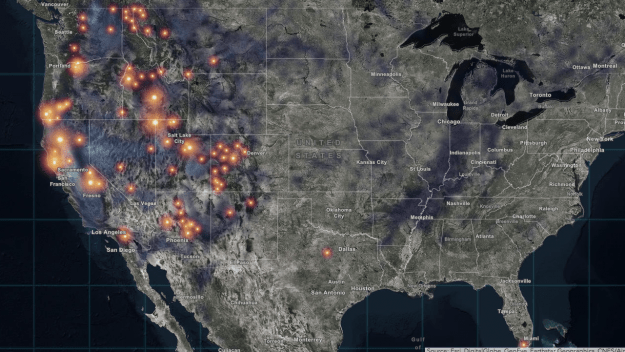
The maps also give a jarring, birds-eye view of just how badly California has been ravaged in just a few months. The most dramatic view might be Esri’s national wildfire map , seen above, which shows active blazes across California and other western states, and includes an option to add a “smoke forecast,” showing how fumes from the fires are drifting across the entire country. The biggest spots on the national map by far are the Carr fire, which has torched more than 163,000 acres since July 22, and the Ranch fire, which has consumed 225,000 acres since July 26, and has since merged with another nearby blaze to become what officials are calling the Mendocino Complex fire.
Other maps show the more localized effects of the fires, particularly the Carr blaze. Cal Fire, the state’s firefighting agency, is pouring its field inspections of damaged structures in Redding and surrounding Shasta County into a publicly viewable map . The large, mostly red splotch around the Redding city limits represents hundreds of homes that were more than 50 percent destroyed. Users can also search for individual addresses to find out if those structures were destroyed.
Another map, put together by the city of Redding , shows users not just the fire’s current perimeter and evacuation lines, but also the latest road closures and locations of evacuation centers (including those that house animals). The map, which is sourced with data from state and local agencies, also shows the fire’s latest hot spots where firefighters are trying to get it under control.
Mapping and geographic information systems, or GIS, are increasingly common tools in response to natural disasters, especially California wildfires. Last year, the state’s Health and Human Services Agency, which regulates hospitals, elder-care homes and childcare centers, started refining the process by which it collects data from the facilities it oversees during a fire, with the goal of having as close to real-time information as possible. As of 2018, the agency now enters its data into an Esri-powered map , where the locations of affected facilities can be overlaid with the latest information from Cal Fire and shared with other state agencies.
GIS technology also gets plenty of post-fire use. With the flames out in Redding, officials have been able to send aerial drones to survey the town from above. Licensed drone pilots from several hundred miles away in Alameda and Contra Costa counties visited Redding over the weekend to help the city capture 360-degree photographs. The resulting imagery , /embedded on another map, gives a brief glimpse of the Carr fire’s devastation.