Philadelphia’s new data dashboard aims to revitalize troubled neighborhood
Philadelphia has published a new data dashboard, not just for transparency, but as an operational tool to coordinate efforts across agencies, such as combating the open-air drug trade in Kensington, a mostly low-income neighborhood that figures prominently in Mayor Cherelle Parker’s policy agenda.
The city’s Kensington dashboard, launched last month by the Office of Philly Stat 360, a 2024 initiative to improve city services, allows officials and residents to dig into the hyperlocal data of the neighborhood — including crime trends, fire incidents, service requests and outreach efforts. The project, which included direct input from residents, reflects a shift in how Philadelphia is using data to address complex issues.
City officials can, for instance, layer fire incident data with property ownership records to identify patterns tied to vacant or neglected buildings. Kristen Bray, Philly Stat 360’s director, said that particular analysis has already informed changes to enforcement strategies targeting property speculators whose holdings may contribute disproportionately to neighborhood instability.
“One of the things that we have seen in this community is that we have a bunch of property speculators who are buying up properties and leaving them vacant. There is a problem with the population as living unhoused on the streets, because they are using [drugs] openly in the community,” Bray explained in an interview. “They go into those locations and they start to set fires, be it in the vacant property or into in certain barrels on the street themselves, allowing us to track where those fire incidences happen.”
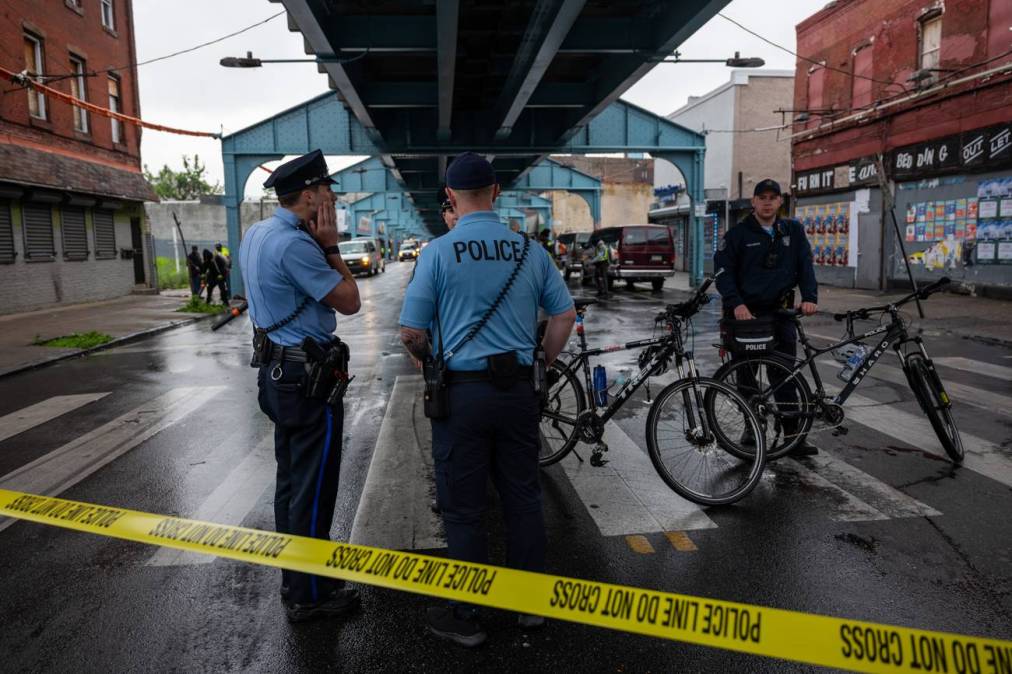
In a 2022 report, the Department of Justice dubbed Kensington “one of the largest illicit drug areas in the country,” and cited several factors, including city management and attempts at mitigation, including increased police presence and stricter enforcement policies, that led to increased reports of drug activity and criminal behavior in the area.
Last year, one year after she was elected mayor, Parker declared a public safety emergency to “permanently shut down all pervasive open-air drug markets,” and called for a 100-day plan to address the conditions that allow this criminal activities to thrive in Kensington.
Bray said the dashboard builds off Parker’s previous initiatives to revitalize the neighborhood, including establishing a 24/7 incident command center and a Kensington Neighborhood Wellness Court, an initiative that offers people facing misdemeanor charges associated with public drug-use services like same-day physical and behavioral health assessments. The city began also more tightly regulating mobile services, such as food distributors and mobile medical care.
“This was created as part of Mayor Parker’s vision to give individuals a government they can see, touch and feel,” Bray said. “We are mapping those issues so residents can see the same things city leaders are seeing in real time.”
The Kensington dashboard is organized into four categories — community, public safety, quality of life and wellness — with much of the data pulled directly from agency systems, including police, behavioral health, licensing and inspections, and streets. Bray said the city connected those systems through a centralized data layer that is frequently updated, but that also ensures privacy protections and that the data is validated.
“Real time accountability is incredibly important, because if you don’t know what’s going on in the background in real time, you can’t fix it,” Bray said.
She said her office formally began planning the dashboard last year following a series of meetings with the community, which she said helped shape what appears on the platform: The office “started to discover things that were much more important to the community than maybe what government initially thought.”
City leaders initially prioritized enforcement metrics tied to Kensington’s widely publicized open-air drug market, but residents pushed for broader visibility into neighborhood resources and community activity. As a result, the dashboard includes features like a shared events hub for local organizations, for residents who wanted better coordination across community groups, alongside more traditional government metrics.
“This is not solely a police problem, you can’t arrest your way out of it,” Bray said. “There is a number of different factors that go on in every community that lead to a sense of disorder, and if you’re not bringing every city resource to the table to try to solve that disorder and improve it, you’ll never be able to solve complex issues like what is happening in this community.”
The dashboard also incorporates Philadelphia’s 311 service data, which tracks how quickly agencies respond to resident complaints in Kensington, including whether departments meet established service-level agreements, a metric that Bray acknowledged can expose underperformance: “For example, if I call in a dangerous building, I believe the SLA is the department is going to respond within five days. If they did not do that, then we would know that they closed that service department request late.”
She said the office’s long-term goal is to create a network of interoperable dashboards that both reflect neighborhood-specific needs and contribute to a citywide view of operations: “We believe the public should have a voice in shaping which neighborhoods are prioritized next, just as community input was a primary driver in determining what data was featured in the Kensington Dashboard — gathering that input will be a key step before any formal expansion decisions are made.”