Cities are giving their AI chatbots a new dimension: geography

While many local governments have deployed generative artificial intelligence chatbots that can answer questions, summarize documents or help employees draft responses, cities are now beginning to give those systems another dimension: geography.
By connecting AI assistants to geographic information systems (GIS), cities are experimenting with chatbots that can understand not only what government does, but where it happens. Instead of simply answering questions about building permits, trash collection or parking tickets, these systems can potentially respond to location-based questions such as, “What construction projects are happening within a mile of my house?” or “Is my property in a flood zone?”
The tech offices in Maricopa County, Arizona, and Washington, D.C., have launched tools within the last year that offer this advanced search capability to residents. Leaders there say the tools help to make government more accessible, but also introduce new challenges around data quality and ensuring that AI-generated answers accurately reflect government data.
Mari and Marco
Kacie Baker, geographic information officer of Maricopa County, and Aaron Judy, the county’s chief of innovation and emerging technologies, said that they first started “dabbling with” conversational interfaces, including Amazon Echo voice assistants, SlackBots and IBM Watson’s models, from 2017 to 2019.
“We had an internal Slack agent that we were using, and some of the leadership said, ‘That’s really cool. Can you make that answer constituent questions for the public?’” Judy told StateScoop. “And I was like, ‘Well, it’s not really enterprise class. It was just a SlackBot that we had had.”
In 2019, Judy left to join the county clerk’s office where in early 2020 he helped to launch Cleo, an AI virtual assistant built on IBM Watson reasoning for the Clerk of the Superior Court that can help citizens with directions, office wait times and service information. When he returned to the county’s Office of Enterprise Technology & Innovation, he said one of his first directives from leadership was to “get this conversational AI off the ground.”
From there, Judy and Baker said they designed two twin agents, both built on IBM Watson conversational models: Mari, which is the public-facing constituent support agent, and Marco, the internal, employee-facing agent. Both agents function at the top of a stack as orchestration agents, with multiple sub‑agents and tools. Both have a Retrieval-Augmented Generation ( RAG) search agent — an AI system that combines smart search tools with language models to look up external data, check its quality and then produce accurate answers — for text and content, with a set of GIS tools from Esri that handle any requests for any spatial information.
After testing 11,000 prompts, the system was formally launched in June 2026 and currently sees an average of 706 users per month. Since the launch, Mari has been asked over 12,000 questions. According to statistics provided by Judy, 14% of the questions were about property taxes or tax payments, another almost 8% had to do with pet adoption and availability, and 3% concerned county jobs and job openings.
“We do have these prompts when you first open Mari of some of the most common things that people are looking for. So if you hit dogs, you know it’ll kind of show you a list of a few dogs that are available just right off the bat,” Baker said. “But when it’s done — say I’m a big fan of northern breeds. So say if I look for a husky, it’ll give me a list of any huskies available. So I say ‘Any huskies?’ and it’ll tell me where the huskies are and how many are available and how old they are, if they’re a mix or a perceived mix… and then the link to go look them up and their name.”
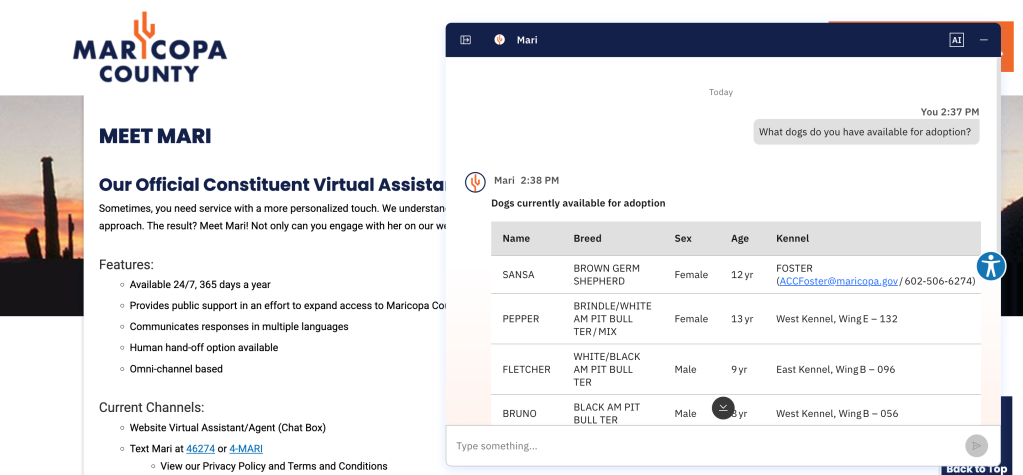
Both Judy and Baker described another set of searches that residents make, which they collectively refer to as “nearest neighbor” searches, which are when residents ask Mari to “Find the closest relevant thing to this location.” For Mari and the Esri stack, that means the system takes their address, turns it into a point on the map and then looks at a dataset of points of whatever it was they were looking for, and calculates the distance from your location to each point. It returns the closest ones — or, their nearest neighbors.
Because Mari may deal with personal information, like a resident’s location, it does provide policy warnings, access controls and limited retention schedules when residents can enter personal details. The county’s privacy policy also discourages sharing sensitive information. Judy said conversations are accessible only to designated staff through an internal curation dashboard and are retained for roughly 13 months for statistics, topic modeling and system retraining before being purged.
The county also uses guardrails to keep Mari grounded in official county data and prevent it from providing legal advice or disclosing sensitive information. Its internal employee-facing version, Marco, has even more restricted access because employees may ask about personal matters such as benefits. Those safeguards, Judy noted, become particularly important as Mari uses information provided during a conversation to build on subsequent questions.
“The cool thing is, I can chain these together contextually, right? So now that she has my address, she knows my parcel number,” Judy said. “I’m chaining together multiple spatial tools without having to change context. It’s carrying it forward through the sessionIt’s really powerful because then I don’t have to tell you my life story.”
DC Compass
In Washington, D.C., the city’s Office of the Chief Technology officer has also deployed a chatbot compatible with Esri’s GIS technology, but for its open data portal.
While DC Compass was launched in March 2024 as a pilot in partnership with Esri, DC Chief Technology Officer Stephen N. Miller said the tool can be traced back to Mayor Muriel Bowser’s 2016 order establishing a chief data officer and open data policies. The order also set the goal of increasing transparency across the city’s datasets and accountability by helping residents navigate the data’s complexities.
Miller said Chief Data Officer Matt Sokol, who took the role in April 2023, also heard repeatedly from residents that the open data portal was difficult to understand and navigate. To incorporate some of that feedback, the tool started as a closed private beta with trusted users to test capabilities, identify issues, and refine the experience before exposing it to the wider public.
After the private beta, OCTO moved to a public beta version, widening the user pool to collect more diverse feedback. DC Compass was then finally approved for full production in March and was made accessible to anyone using Open Data DC and anonymous access so residents don’t need Open Data accounts to use the feature.
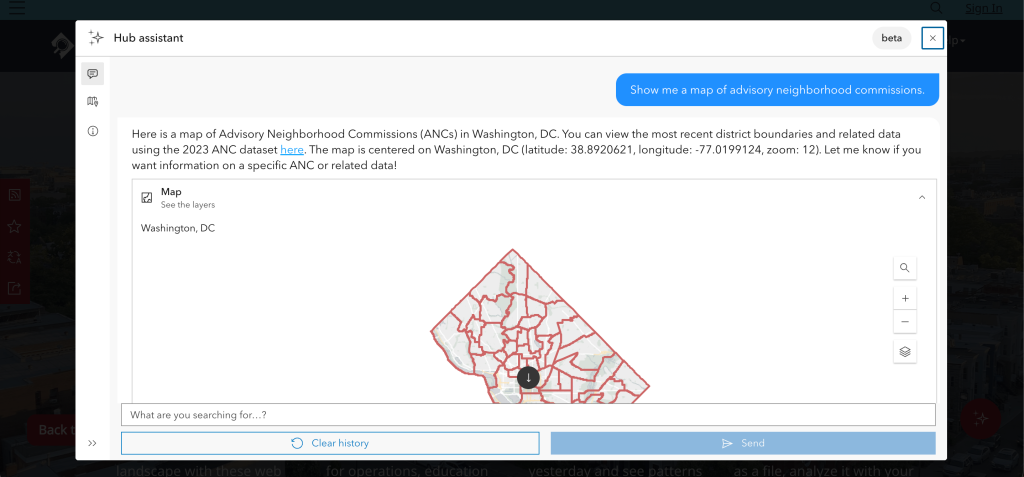
DC Compass offers connections to the city’s over 700 public datasets, allowing residents and government employees to query that data in plain language and multiple languages. Miller said it sits directly on top of the city’s Esri-based GIS and open data environment, acting as the AI “front door” to hundreds of spatial and tabular datasets.
The tool surfaces results across both mapping and non‑spatial datasets, and residents can ask the tool to perform “nearest neighbor” searches, such as detailing where the nearest parks or green spaces are to a certain address, or where the closest schools are. The tool can also create maps of date, such as maps of crime over the past year in a particular neighborhood, or traffic incidents and 311 requests.
OCTO is already eyeing ways to embed Compass into GIS hub sites and city webpages, turning existing geospatial infrastructure into other conversational, AI-assisted experiences.
“We know that this platform can extend out, and can be embedded in things like our websites. It can be embedded in things like our GIS hub sites that we create for initiatives and projects across the city, especially geospatial projects,” Miller said.
OCTO still considers DC Compass a beta and foundational platform, with plans to expand it to additional government websites and GIS hub sites. Eventually, the District envisions using the technology with higher-sensitivity internal data, though those applications would be subject to stricter controls. But for now, Miller said the tool also serves another purpose: increasing transparency and accountability across the city.
“The biggest thing is with tools like this, we want to see it increase the analytical power of our residents to increase that accountability. We can be as transparent as possible, but in order to hold us accountable, you have to be able to find the right data,” Miller continued. “I can make assumptions on what people want to see, but this tool goes beyond those assumptions. It opens it up, it broadens access, it broadens capability, and it creates something at a scale that moves a bit faster than we normally would be able to because it’s providing that assistance.”