Here’s how much every state is getting from BEAD grant program

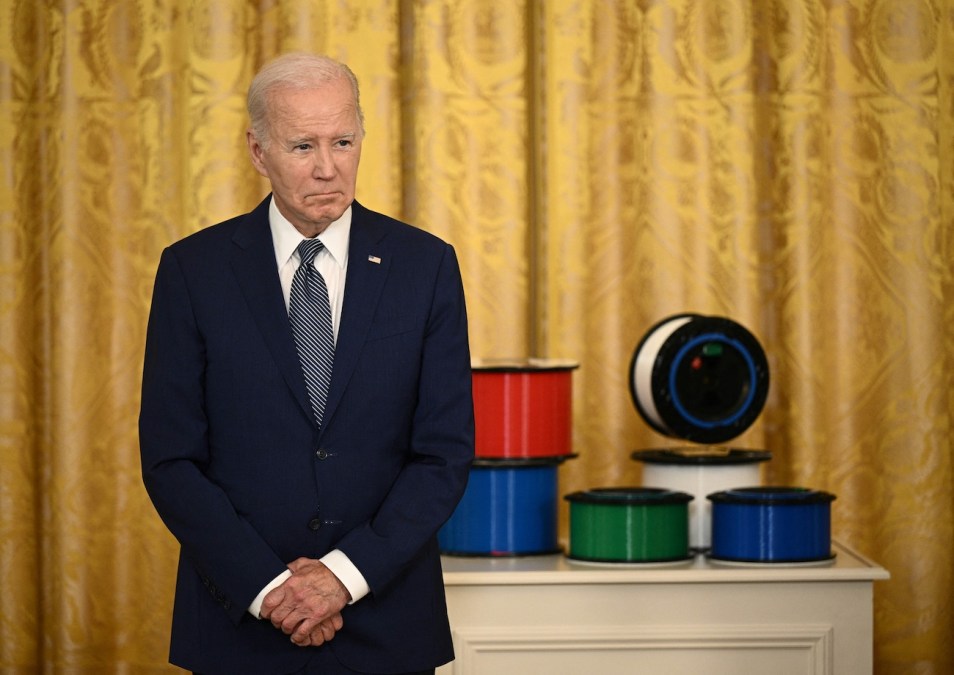
The Biden administration announced funding allocations for the $42.5 billion Broadband, Equity, Accessibility and Deployment grant program on Monday, which officials said paves the way for all Americans to have access to affordable, reliable, high-speed internet service by 2030.
Texas received the highest allocation at more than $3.3 billion, followed by California at $1.9 billion and Missouri at $1.7 billion. Nineteen states were awarded more than $1 billion.
Every state, plus Puerto Rico and Washington, D.C., was awarded at least $100 million, while outlying U.S. territories received at least $25 million.
The funding amounts were informed in large part by the Federal Communications Commission’s broadband coverage map, which shows at least 8.5 million locations without access to high-speed internet.
“This is a watershed moment for the millions of people across the country who lack access to a high-speed Internet connection who will soon have this necessary service to learn, work and play,” Alan Davidson, Assistant Secretary of Commerce for Communication and Information, said in a press release. “States can now plan their grant programs with confidence and engage with their communities to ensure they spend this money where it is most needed.”
The 10 biggest BEAD allocations:
| State/Territory | BEAD Allocation |
| Texas | $3,312,616,455.45 |
| California | $1,864,136,508.93 |
| Missouri | $1,736,302,708.39 |
| Michigan | $1,559,362,479.29 |
| North Carolina | $1,532,999,481.15 |
| Virginia | $1,481,489,572.87 |
| Alabama | $1,401,221,901.77 |
| Louisiana | $1,355,554,552.94 |
| Georgia | $1,307,214,371.30 |
BEAD allocations by state/territory:
| State/Territory | BEAD Allocation |
| Alabama | $1,401,221,901.77 |
| Alaska | $1,017,139,672.42 |
| Arizona | $993,112,231.37 |
| Arkansas | $1,024,303,993.86 |
| California | $1,864,136,508.93 |
| Colorado | $826,522,650.41 |
| Connecticut | $144,180,792.71 |
| Delaware | $107,748,384.66 |
| D.C. | $100,694,786.93 |
| Florida | $1,169,947,392.70 |
| Georgia | $1,307,214,371.30 |
| Hawaii | $149,484,493.57 |
| Idaho | $583,256,249.88 |
| Illinois | $1,040,420,751.50 |
| Indiana | $868,109,929.79 |
| Iowa | $415,331,313.00 |
| Kansas | $451,725,998.15 |
| Kentucky | $1,086,172,536.86 |
| Louisiana | $1,355,554,552.94 |
| Maine | $271,977,723.07 |
| Maryland | $267,738,400.71 |
| Massachusetts | $147,422,464.39 |
| Michigan | $1,559,362,479.29 |
| Minnesota | $651,839,368.20 |
| Mississippi | $1,203,561,563.05 |
| Missouri | $1,736,302,708.39 |
| Montana | $628,973,798.59 |
| Nebraska | $405,281,070.41 |
| Nevada | $416,666,229.74 |
| New Hampshire | $196,560,278.97 |
| New Jersey | $263,689,548.65 |
| New Mexico | $675,372,311.86 |
| New York | $664,618,251.49 |
| North Carolina | $1,532,999,481.15 |
| North Dakota | $130,162,815.12 |
| Ohio | $793,688,107.63 |
| Oklahoma | $797,435,691.25 |
| Oregon | $688,914,932.17 |
| Pennsylvania | $1,161,778,272.41 |
| Rhode Island | $108,718,820.75 |
| South Carolina | $551,535,983.05 |
| South Dakota | $207,227,523.92 |
| Tennessee | $813,319,680.22 |
| Texas | $3,312,616,455.45 |
| Utah | $317,399,741.54 |
| Vermont | $228,913,019.08 |
| Virginia | $1,481,489,572.87 |
| Washington | $1,227,742,066.30 |
| West Virginia | $1,210,800,969.85 |
| Wisconsin | $1,055,823,573.71 |
| Wyoming | $347,877,921.27 |
| American Samoa | $37,564,827.53 |
| Guam | $156,831,733.59 |
| Northern Mariana Islands | $80,796,709.02 |
| Puerto Rico | $334,614,151.70 |
| U.S. Virgin Islands | $27,103,240.86 |


